Debugging is a part of TVML app development, just like any software development. In part 11 of my “Making Apple TV Apps” series, we’re learning how to debug TVML apps.
I Ain’t Afraid of No… Bugs
 Now that we’ve created our first TVML-based app, its only a matter of time before we need to debug it. You may be wondering what enhancements have been made to Xcode so it can provide the same powerful tools for debugging JavaScript apps as native apps. If so, it will probably surprise you to learn that Apple didn’t add anything to Xcode in this regard. They didn’t have to, because we already have a powerful JavaScript debugger installed on our systems: the Safari web browser.
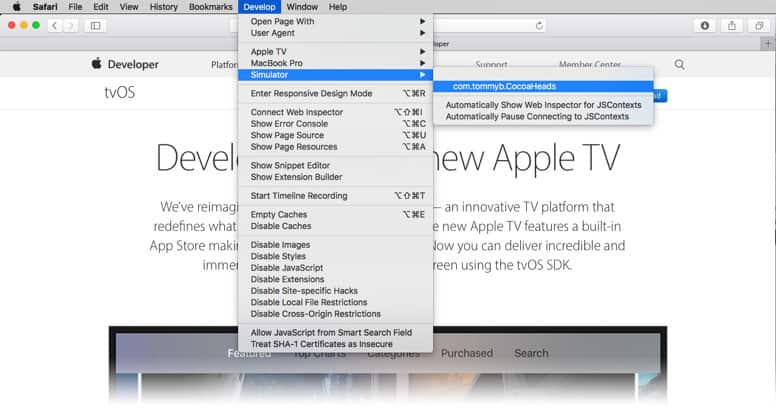
Yes, you read that correctly. You can launch and debug your TVML-based app using Safari as though your Apple TV app is a web app. If you’ve ever debugged web apps in Safari before, you should now see a Simulator option added to Safari’s Develop menu. If you have an Apple TV device connected to your system, you’ll see an Apple TV option has been added as well. These new options allow you to debug your app by launching it in the simulator or on your device.
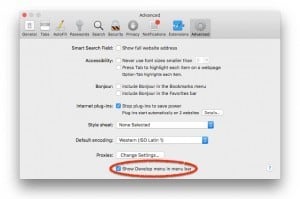 Don’t sweat it if Safari’s menu doesn’t contain the Develop menu option. Open Safari’s preferences and navigate to the Advanced tab. You’ll see a Show Develop menu in menu bar option at the bottom of the tab. Check that option and the menu will be added.
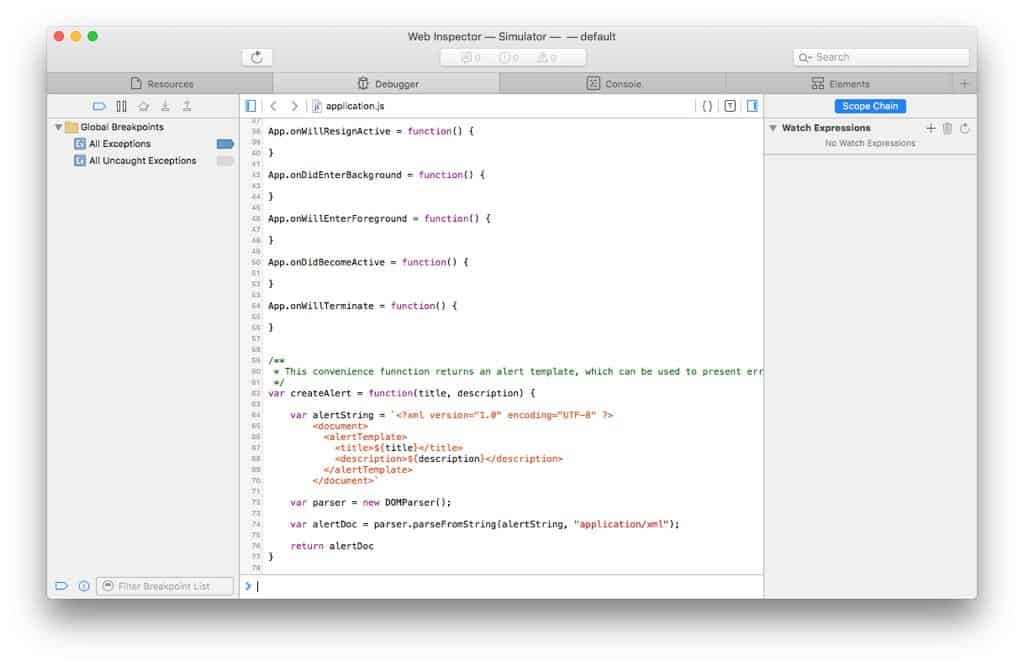
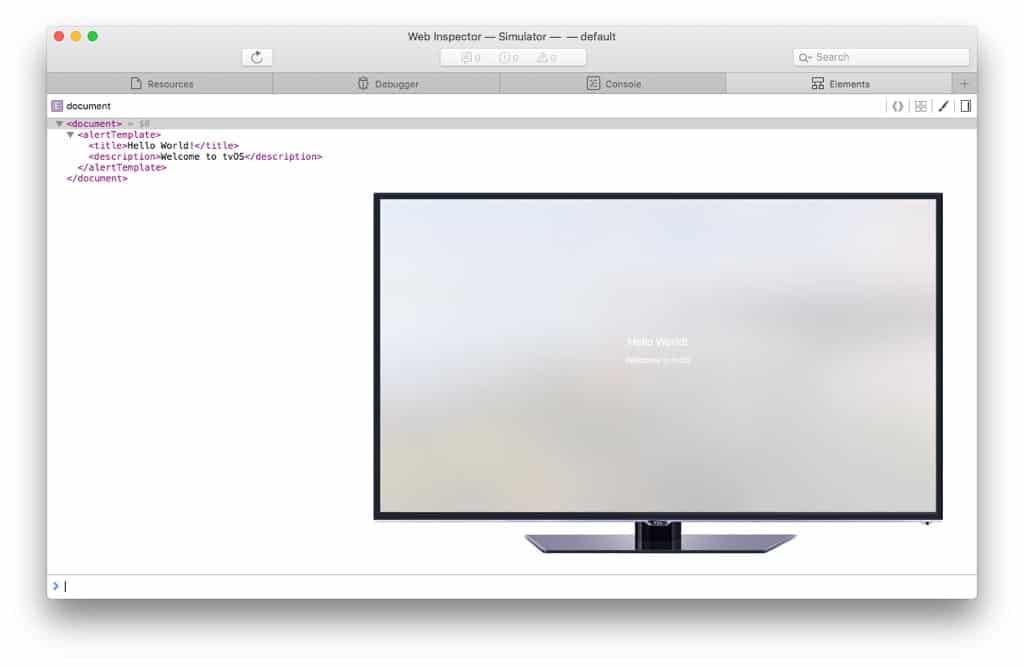
Once you launch your app from the Develop menu, Safari will display the Web Inspector window. This will be familiar territory if you’ve done any web app development. The experience is identical.
We see our application.js source file, including the createAlert helper function we talked about in the last article, loaded in the Debugger tab. Look closely at the structure of the XML data that is being instantiated in that function. When we switch to the Elements tab, we’ll see the resulting DOM document exactly mirrors that XML data. These few element nodes are all it takes to display the “Hello World” message we saw on our Apple TV a few minutes ago.
Where’s My Console Output?
One last tip for anyone that hasn’t used Safari for web development before: Any output intended for the console from your JavaScript code will be displayed in the Web Inspector’s Console tab, not the debug window in Xcode.
Go Further
If you haven’t worked on web apps before, there are plenty of online resources that explain how to use Safari’s Web Inspector to its fullest. Apple’s Developer Introduction to Safari is a great place to start.
That wraps up today’s article. Coming up in part 12 of the series, we learn how to extend the capabilities of TVML with our own custom tags. Sign up to receive it ASAP or come back again soon. Until then, remember this: Be the windshield, not the bug!
Leave a Reply