In part 3 of this series, I explain how memory management is handled in the Xamarin world, what I consider to be myths surrounding memory management, and my initial conclusions after investigating the problems.
NOTE: Just a quick reminder that the presentation this series is based on was created in September, 2013. Things have improved since then. I will occasionally add notes with updates when appropriate.
After getting the upgrade, I launched the Xamarin “Heap Shot” profiler and tested the app as seen in the above video. Xamarin’s Heap Shot profiler is pretty basic, but it gets the job done. I went through the workflow of creating a new XNote and sharing it with other XNotes users multiple times.
Each time the workflow is completed, XNotes returns the user to its main menu screen. At this point, all the user interface components that were used during the workflow SHOULD be no longer needed and released from memory. The actual result was the opposite. I found that NONE of those class instances were being released.
Now you know what led to me needing a deep dive into how memory is managed in Xamarin apps. Lets discuss how it works.
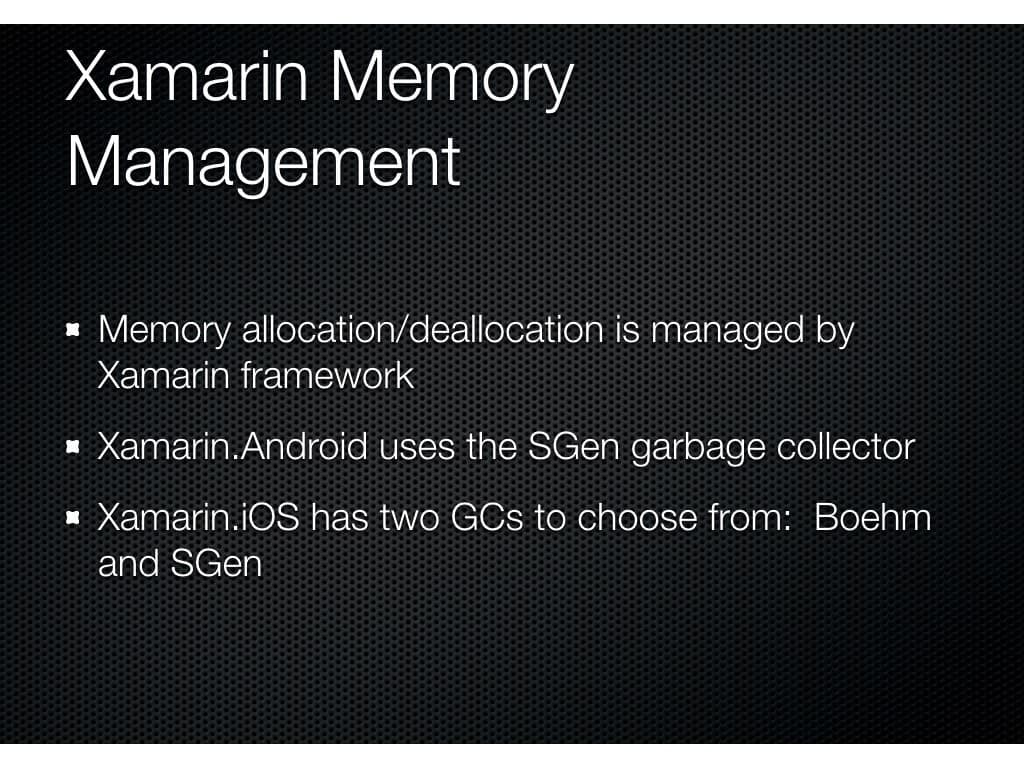
First, all allocation and deallocation of memory is managed by the Xamarin framework. These capabilities are implemented using what is called a garbage collector. We’ll talk about what a garbage collector does in a second.
Xamarin provides different garbage collector options for the Android and iOS platforms. Xamarin.Android uses a GC called SGen.
Xamarin.iOS offers two GCs to choose from—the older Boehm garbage collector, and the newer SGen one, which is labeled as experimental on the iOS platform.
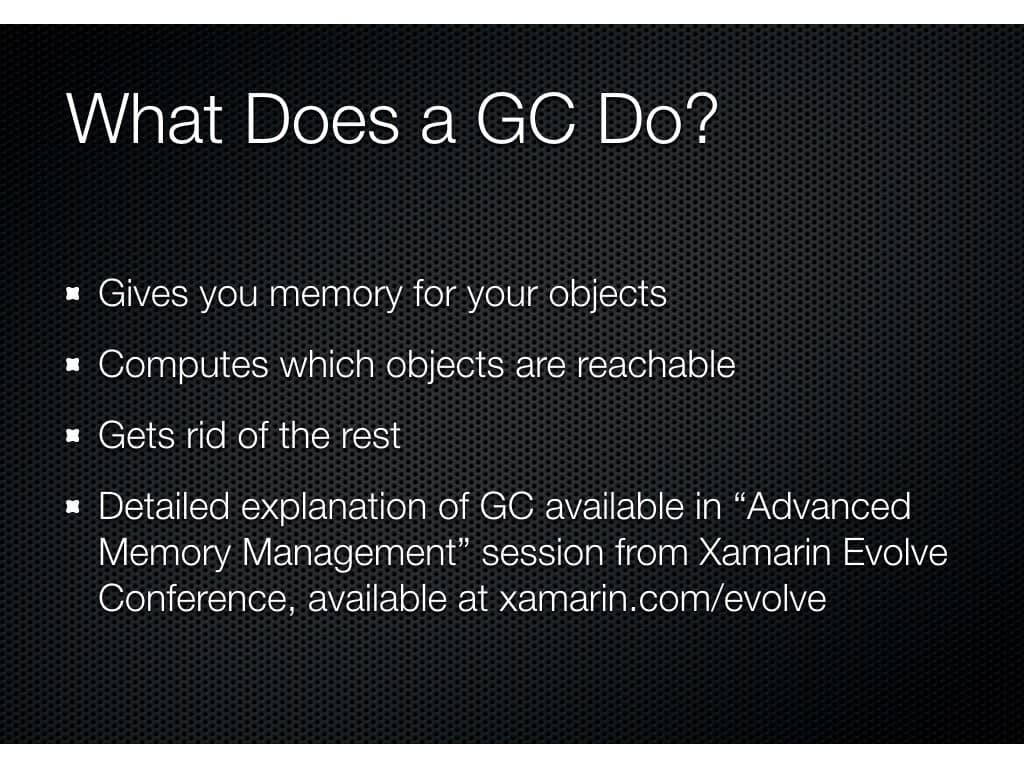
So what exactly does a garbage collector do? It gives you memory for your objects, occasionally computes which objects are reachable, and gets rid of the rest.
Garbage collectors typically perform their work using a process called mark and sweep. This process is usually performed in a two-pass operation. In both passes, all the memory allocations in the target memory region are iterated. In the first pass, instances that are referred to from other instances are marked as being in use. In the second pass, any instances that weren’t marked are considered eligible for garbage collection and are released from memory.
If you’d like to learn more about how this works, there is a great Xamarin Evolve Advanced Memory Management session video available on the Xamarin Evolve [2013] website.
The two GCs approach the garbage collection process a little differently. The Boehm GC reviews the entire heap for objects that are no longer needed at one time. This can be a lengthy operation when it is performed.
The SGen GC divides the heap into multiple areas: The Nursery, which is where new small memory blocks are allocated, the Major Heap, which manages long-running allocations, and the Large Object Space, where allocations of more than 8,000 bytes are made.
While 8,000 bytes doesn’t sound like much, keep in mind that most memory allocations are for the managed C# objects that are used to track and interface with the underlying OS’s native object instances. Those memory allocations are typically 64 to 128 bytes each.
SGen tends to perform smaller, more frequent sweeps than the Boehm GC.
Boehm performs the GC process on the main app thread, while the SGen GC is multithreaded. Since the Boehm process is performed on the main app thread, it will effectively freeze your app for however long it takes to perform its work. Not good!
As I mentioned earlier, the Xamarin team is confident enough in the SGen GC implementation on the Android platform that it is the only available option.
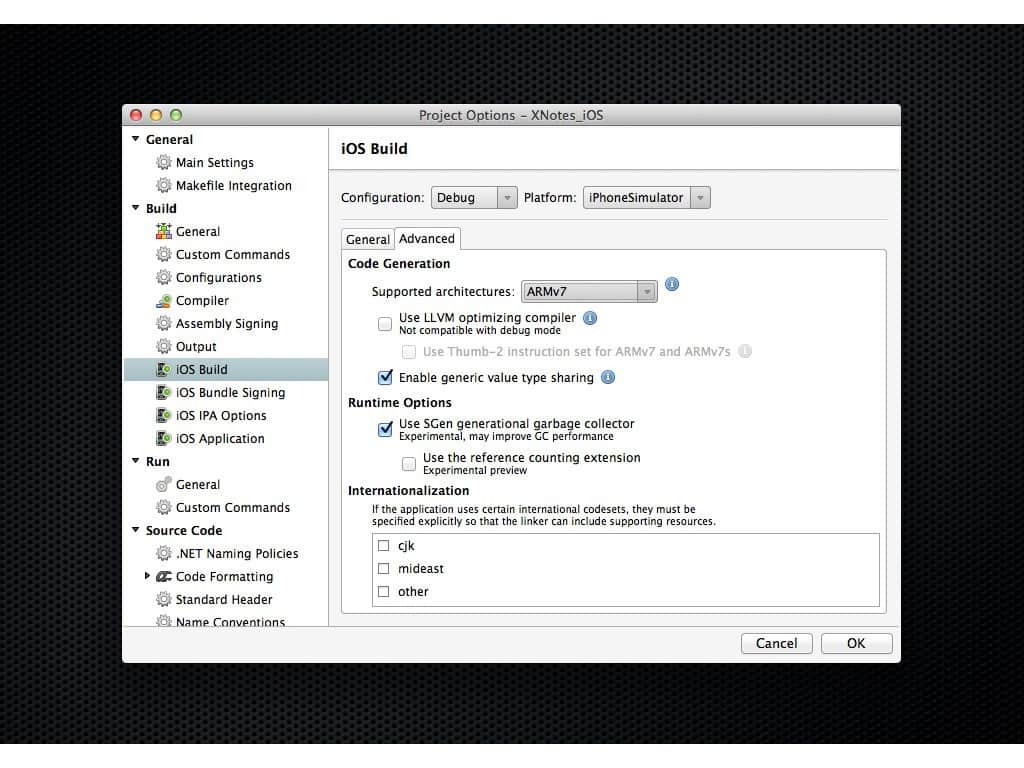
They’re not at that point on the iOS platform yet. Choosing which GC you want to use in your iOS app requires a visit to your project settings’ Build – iOS Build options. You’ll see a Runtime Options section in the Advanced tab.
Since the Boehm GC is used by default, it isn’t mentioned in this dialog. Instead, there is a Use SGen generational garbage collector checkbox provided.
There is also another option labeled Use the reference counting extension. It also has an additional note that reads Experimental preview. Reference counting is another technique used by garbage collectors for determining when an object instance can be released. It is a relatively lightweight technique when compared to the mark and sweep process. You will always want your memory allocations to be released due to a zero reference count instead of the mark and sweep process if your garbage collector supports reference counting.
Reference counting works by adding a counter value to every object instance. Every time a reference to the instance is assigned somewhere, the count is incremented. The count is then decremented whenever a reference is cleared. This can occur when the reference property has another instance or null assigned to it.
When the count is decremented, the counter value is compared to zero. If it is zero, the memory allocated for the instance is immediately released.
A final thought on these choices: Since both the SGen GC and reference counting extension are labeled as being experimental, you will need to thoroughly test your app AFTER enabling these options if you decide to give them a try.
2016 Update: Both the SGen garbage collector and reference counting extension are now the default memory management options used with the Xamarin.iOS framework.

My personal experiences with memory management goes way back to my days of writing C and C++ code in the early 90s. Garbage collectors didn’t exist back then…

…at least not when we were talking about writing application code.

With C and C++ based applications, we were responsible for managing all the memory allocations and deallocations in our own code. It meant a fair bit of code had to be written that we don’t have to worry about these days. However, it also meant, in my opinion at least, that pinpointing memory leaks and fixing them were a lot easier. Developers using these languages got into the habit of always writing the deallocation code immediately after writing any allocation code, and life was good for the most part.
So, back to the modern day here. The problems I saw in my Xamarin app aren’t exclusive to it. I’ve run into the same kind of issues with garbage collectors on other platforms, including some real nightmare situations. The worst case was when I was part of a 6 developer web client team using Adobe Flex for a $20 million project. The memory issues encountered with this project weren’t found until AFTER it had gone live. The site was a data-driven retail store for a Fortune 25 company. It served as the client’s primary North American online presence for selling content to millions of customers.
It turned out that the data used during the project’s development and testing was much smaller than what was being received by the client when the site went live. Then, the app was faced with a substantially larger content catalog, and it exhausted all memory and froze the customer’s QA systems after navigating through just 4 pages on the site! Even on our beefed up development systems, we couldn’t view more than 12 pages before the entire system locked up and required a hard reboot.
Needless to say, the client, who had been very demanding at every step in the project, was not happy. I was put in charge of tracking down the issues behind the problems and fixing them. In the meantime, the client reduced the number of items being offered until they were able to navigate a reasonable number of pages on their QA systems.
Three weeks later, after having gone through many of the same approaches I’m going to share with you in this series, the app was successfully releasing memory when users navigated from one page to another on the site as expected. Whew! 🙂
So with all that said, I would like to point out what I consider to be garbage collection myths. I believe most developers think these statements regarding garbage collection are true until they run into the problems I’ve described.
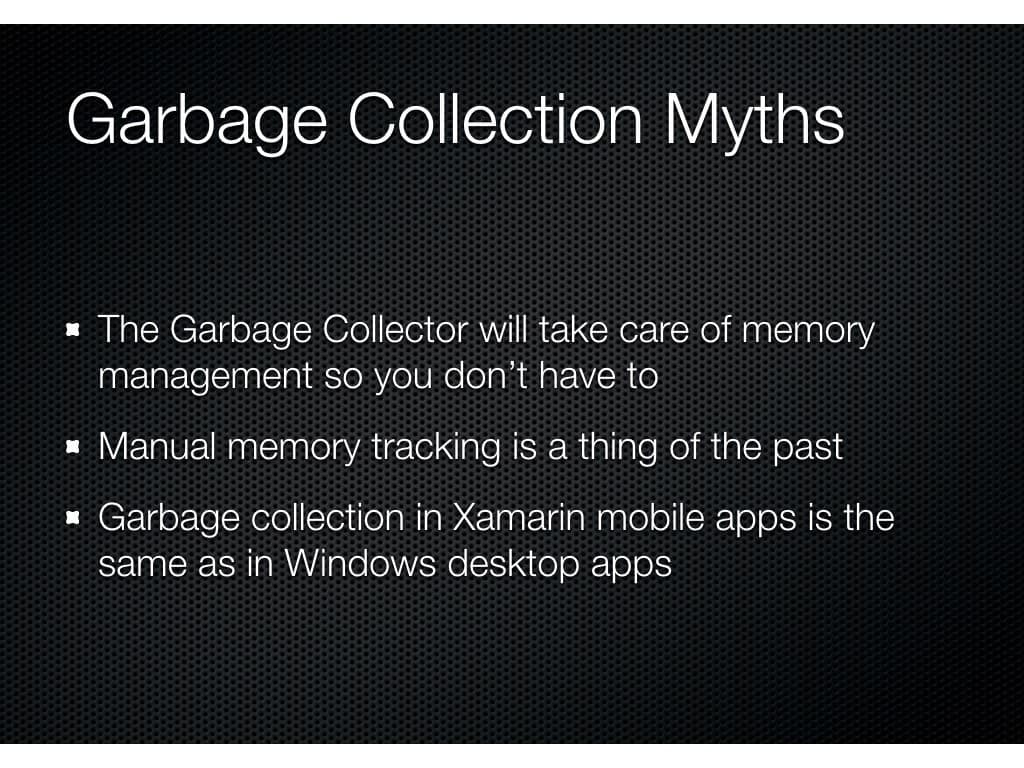
The first myth is that the garbage collector will take care of memory management so you don’t have to.
Consequently, the second myth is that manual memory tracking in our own code is a thing of the past.
Finally, and this is Xamarin specific, garbage collection in Xamarin mobile apps isn’t any more of a concern than in Windows desktop apps.
Unfortunately, these statements aren’t true in my experience.

But don’t take my word for it. See for yourself by taking the steps that I took. Google “xamarin memory leaks”—you’ll find lots of links to questions being posted on Stack Overflow and other sources after developers run into these issues.

Search the Xamarin developer forums. You’ll find further proof that memory management is a real problem that has barely been documented at all, much less adequately so, in either Xamarin’s documentation or their “best practice” sample apps.
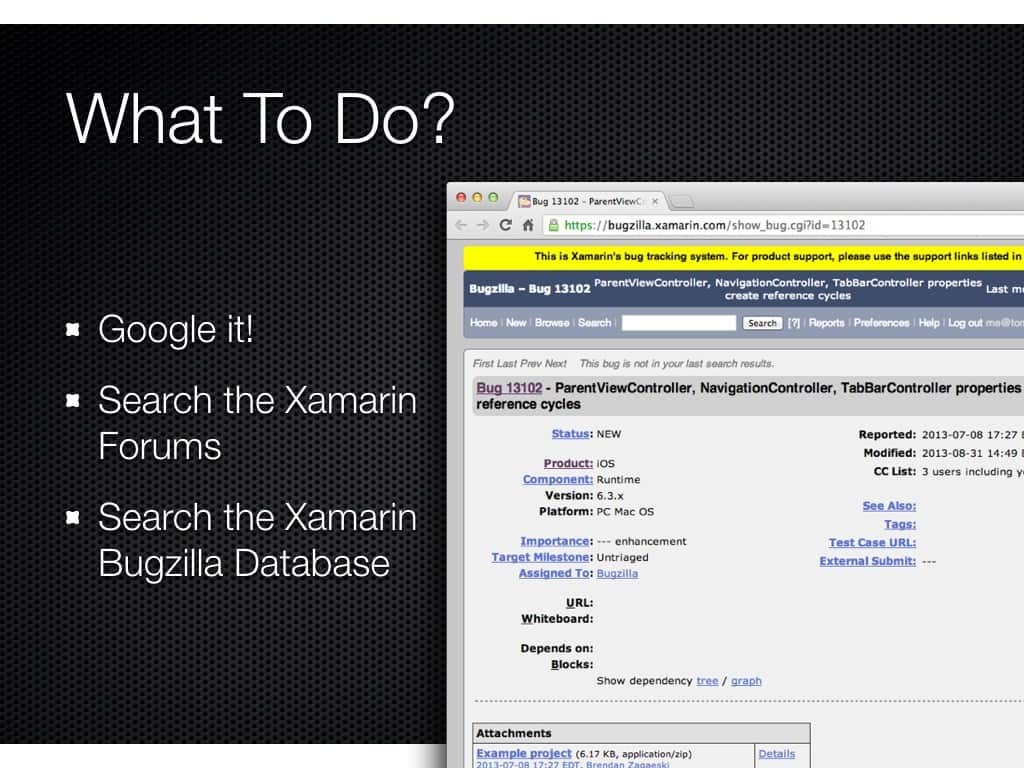
Unfortunately, it gets worse. If you search Xamarin’s Bugzilla bug database, you’ll find cases where some memory leaks are caused by the Xamarin framework instead of our application code. Many of these cases provide temporary workarounds, but you wouldn’t ever know about them unless you had run into the problem and searched for answers.
Finally, there is this post from a couple of years ago that I found from Miguel de Icaza, the CTO of Xamarin and father of Mono. Miguel explains in detail how the Xamarin framework works with the underlying native operating systems. Specifically, managed “wrapper” objects are allocated and attached to the underlying native OS objects, as I’ve mentioned earlier.
He elaborates on how this works, and the different situations that have to be handled. He then gives an iOS example where their attempt to keep track of the underlying OS objects fails. The result is a memory leak.
The iOS example Miguel describes is using a UITableView and its built-in cell styles. A memory leak will occur if we use the default cell classes and attach managed code to them. He then points out an easy workaround, which is to always create and use a subclass of UITableViewCell instead of instantiating a UITableViewCell instance directly. The memory leak will no longer occur because the Xamarin framework will now know when the native OS cell instance is being released.
Even though Miguel does a great job explaining the reasons behind this problem in his response, this information was by no means readily available. I haven’t seen this recommendation regarding the UITableView class anywhere in the documentation or implemented in their code samples. With UITableView arguably being the most frequently used UI component in many iOS apps, its not like this is some exotic edge case either.
2016 Update: Xamarin successfully addressed this issue in 2014. They discussed the issue in this Evolve 2014 presentation.
 Here are my conclusions after my initial investigation:
Existing Xamarin samples and documentation don’t bring the importance of memory management best practices to light. However, multiple Xamarin developer and documentation representatives have told me they are aware it is a problem. They’re working to improve their coverage of it.
Unfortunately, this lack of exposure means that developers who are new to Xamarin will inevitably run into memory leaks. However, I don’t want to make this “all about Xamarin,” as you can run into some (but not all) of the same issues when writing Objective-C code for iOS apps or Java code for Android ones.
There is good news though: The problem is solvable, according to seasoned Xamarin developers who have multiple apps under their belt.
Even so, THIS WOULD’VE BEEN A LOT EASIER TO DEAL WITH FROM THE BEGINNING OF MY PROJECT. I hope that this series will prevent you from facing a fire drill when you think your work is done like I did.
Coming Up…
In part 4, I describe the best practices for memory management in Xamarin apps that I concluded after a lot of searching the internet and applying them to my app. Come back soon or sign up for email delivery of that and the rest of this series!


Leave a Reply